 The end of MTN’s free Twitter promotion on 25 September may have led to a massive reduction in the volume of tweets by the users of that service, but it doesn’t seem to have had a significant effect on the volume of activity on the social network in South Africa.
On 22 September, MTN announced that, after more than four years, it was ending its promotion that offered South African subscribers access to Twitter with no data-use charges. The reason given by MTN was that it had become unaffordable to continue to offer the service due to the huge data usage growth. This was ascribed to an increase in image and video content on the platform.
There was an enormous reaction to the announcement, with many on Twitter lamenting MTN’s decision. Complaints ran the gamut from personal anguish to accusations of political interference by the political elite in order to remove the right of expression of the masses.
But what is the actual impact? How many of the users that were using free Twitter access are going to leave the platform because they can no longer afford the data required? Is this short-sighted by MTN and likely to result in churn from its network? What portion of the South African Twitter community were using free Twitter? None of these questions are easy to answer, simply because much of the data is hard to come by.
Analysis of simple research found that the “freeTwitter” users’ activity declined by at least 30%, and that around 18% seem to have stopped posting on the network altogether. Despite this, the impact on the entire South African Twitter community has been minimal. In fact, volumes of tweets in South Africa actually increased after the end of the promotion period.
Called into question
Some of the results of the research also call into question MTN’s claims regarding the number of Twitter users on its network. A back-of-an-envelope (and very imprecise) calculation, based on the number of users that stopped activity altogether, would give the proportion of South African Twitter users on MTN’s network at around 25% — consistent with its mobile network market share in South Africa. According to MTN’s estimates, that would mean that the Twitter community in South Africa is 52-million strong (18% of the entire global Twitter user base), which is extremely unlikely.
Let’s start with the big numbers: how many Twitter users are there in South Africa in total? Nobody knows exactly, except maybe Twitter — and it doesn’t release that information. World Wide Worx’s SA Social Media Landscape 2018 report (released in September 2017) estimates the South African Twitter community at eight million users. This may be slightly conservative due to sampling limitations but seems reasonable given the connected population in South Africa (21 million, according to the research firm) and the global user base of Twitter (approximately 300 million).
 However, MTN claimed there were 13 million users of free Twitter on their network. That is a big discrepancy — MTN is arguing that the Twitter users on its network alone (MTN has around 30% market share of mobile connections in South Africa) outnumber World Wide Worx’s whole country estimate by 60%. Thirteen million also looks suspect because MTN simply has no visibility on its network of actual Twitter user details. What MTN can see is data traffic, and it can identify that traffic based on Internet protocol addresses, by Sim numbers and likely by device IMEI (International Mobile Equipment Identity) numbers. None of these will provide the actual Twitter user account information, so all MTN can measure is the data travelling from one of its network IPs to the Twitter IP. A guess is that the source of the number that MTN has publicised is from 13 million separate devices that have accessed the Twitter IPs over the period that the promotion was active (four years and nearly five months). It is very difficult to link that to a specific number of Twitter users, however.
So, is it possible to measure the impact of the end of the promotion without any definitive data regarding the number of users on MTN or even size of the South African Twitter community? We can’t state definitively what the overall impact is, but it is possible to do some research on a sample of Twitter users that are highly likely to be users of the service, and to measure their aggregated activity on the social network. That should give some indication whether the activity has reduced significantly. Likewise, we can source a random sample of South African Twitter users and see whether there have been similar changes in activity.
To get a sample of “freeTwitter” users, a search using Twitter’s standard search API pulled all the tweets that mentioned the hashtags #RIPfreeTwitter, #freeTwitter and (much lower incidents) #MTNmustfall. This search query harvested tweets between 14 September and 26 September 2018. It resulted in a sample of approximately 38 000 separate Twitter users that had used these hashtags. Unfortunately, since the #RIPfreeTwitter and #freeTwitter hashtags trended after MTN’s announcement of the promotion’s end, there were many spam accounts that utilised the hashtags to gain some exposure. This kind of “hashtag-jacking” is common with trending topics on Twitter.
‘Spammy’
To reduce the impact of these spam accounts, they were filtered using a benchmark proposed by Ben Nimmo of the Atlantic Council’s Digital Forensic Research Lab. He proposes that a Twitter account that posts 72 times per day or more over an extended period is likely to be automated or “spammy”. Seventy-two posts per day is equivalent to a tweet every 10 minutes for 12 hours — an unlikely frequency over a sustained period.
After an initial filter for spam, the complete Twitter timelines of the remaining accounts for the period 1 to 27 September were harvested. The MTN promotion ended at midnight on 25 September, so the sampled tweets would include 48 hours after the end of the promotion.
Once the timelines were pulled, another spam filter was run to remove the accounts that posted at an unreasonably high frequency in the specified period, and a final sample of approximately 6.7 million individual tweets was then analysed.
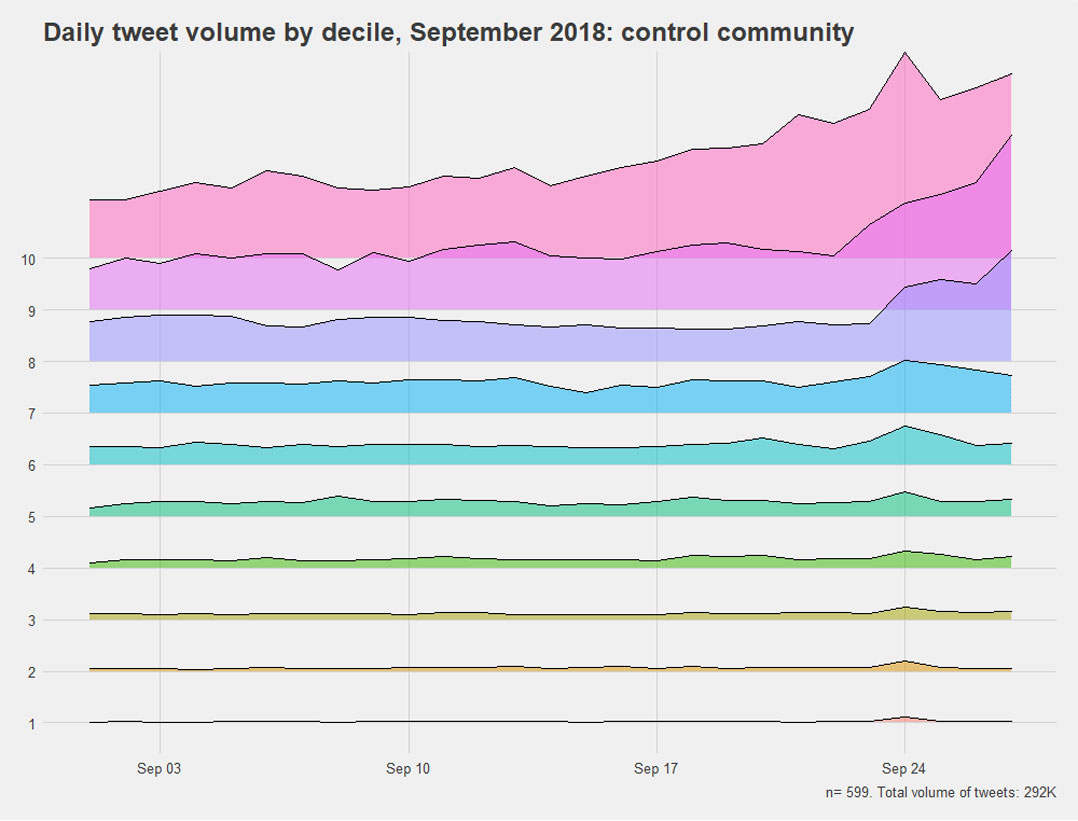
 To get a control sample to confirm that any significant changes in activity in the “freeTwitter” sample are relevant (and not due to general posting patterns) a sample was sourced by conducting a search for tweets geolocated in South Africa on 25 September. From that result, 700 random accounts were selected and their timelines for the studied period were pulled. After filtering the “control” sample for spam, 599 accounts remained in the sample. If Twitter’s geolocation is 90% correct, this sample would deliver a 2.4% confidence interval at a 95% confidence level. In other words, the sample should be representative of the entire South African Twitter community in terms of activity.
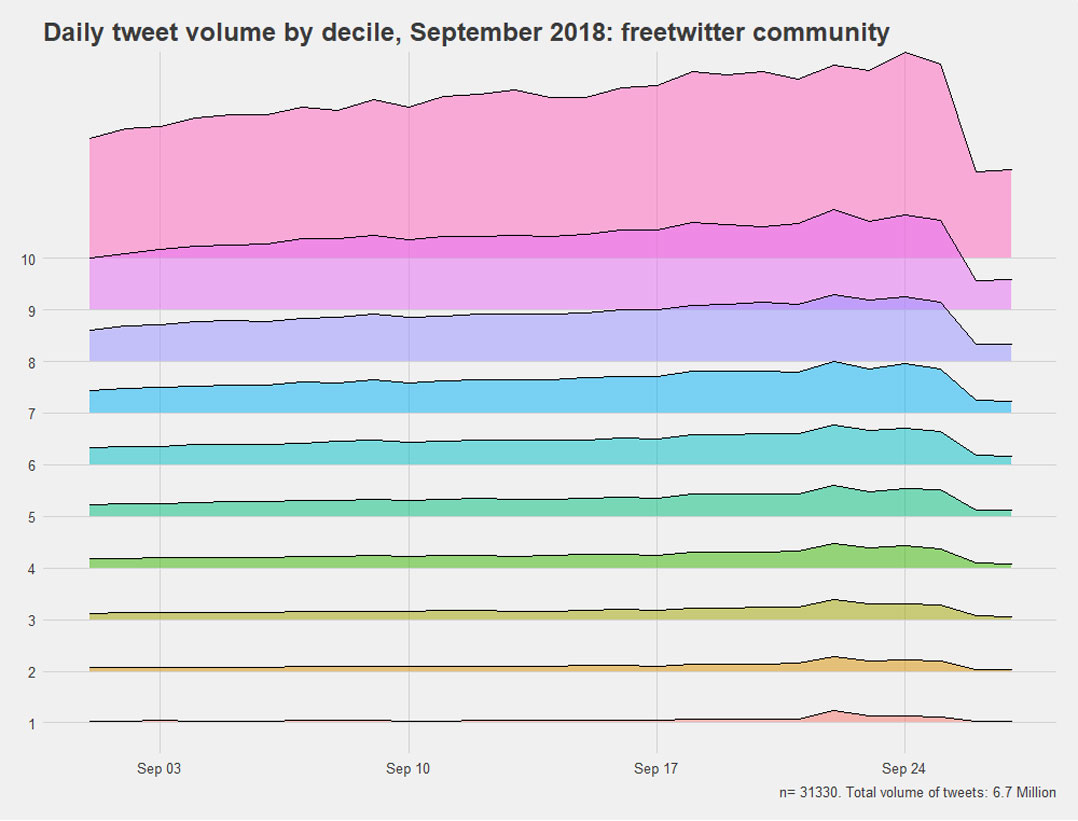
What is immediately apparent from the data is that there is a considerable drop-off in the activity of the “freeTwitter” sample after the cut off on 25 September. The mean daily aggregated tweets of the sample fell by 30%. This is not visible in the control sample where this measure actually increased by 80%.
To see a more granular view of the tweet activity, we can visualise the two samples by decile (see charts below). In both samples, the top 10% of the accounts are responsible for a much higher tweet frequency than the other deciles — this is likely due to some spam accounts that were operating below the threshold of 72 tweets/day.
Another measure of the impact of the end of this promotion is to measure the net number of accounts that are no longer active in the period after 25 September. We can compare the proportion of these accounts in the “freeTwitter” and control samples. In the free Twitter sample, 18.7% of accounts that were active in the month leading up to the cut-off were silent after 25 September. By contrast, the control group had only 4.4% of accounts that were not active after the cut-off.
It is evident that the end of free Twitter has had an impact on a particular community in South Africa: the sample of users that aligned with the free Twitter concept in the content of their tweets had a marked reduction in activity, on the whole by around 30%, but higher in the lower deciles (between 60 and 65% for deciles 1 – 8). In addition, the proportion of users that appear to have stopped using the social media network completely (albeit only for the two days in the sample) in the “freeTwitter” sample is approximately 18.7% (more than one in every six users).
The control group which represents the South African Twitter community at large, by contrast increased daily activity after the end of MTN’s free Twitter by around 80% on average. The loss of users in the control group is also small, less than 5% (note that this will include the free Twitter impact).
From this data, we can conclude that the end of MTN’s service hasn’t really dented the overall activity on South African Twitter, although it has likely had a small impact on the number of users. But it is nowhere near the levels that some have indicated. It also seems that either MTN’s estimation of the size of its free Twitter user base is massively overestimated (due to the limited impact on overall activity), or that most of their users simply carried on using the social network while paying for their data. The latter seems unlikely, given the results in the “freeTwitter” sample. — (c) 2018 NewsCentral Media

