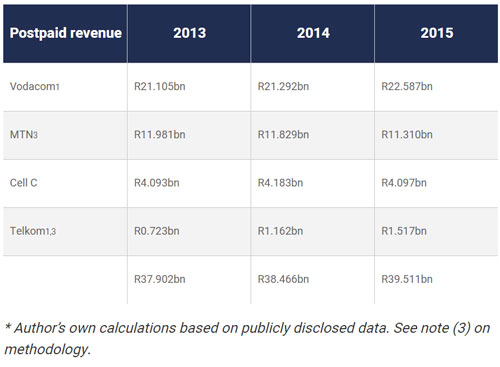
R39,5bn. That’s the amount South Africans spent on cellphone contracts in 2015¹. This analysis of the market is possible for the first time after the publication of a transaction circular by Blue Label Telecoms, which detailed (in some respects, at least) the operational and financial performance of Cell C since 2013.
But the post-paid market is, not surprisingly, barely growing.
For one, the broader mobile market is obviously mature (Sim penetration is comfortably north of 160%). But, there’s a structural limitation to the number of customers that can actually afford a post-paid contract (in other words, they need to be economically active and pass credit and affordability assessments).
There are two ways of looking at this. The number of subscribers only tells half the story. Besides, an analysis of post-paid subscriber growth is almost impossible given that we only have a solitary data point for Cell C, namely a breakdown of subscribers as at 30 June 2016. Following the money sketches a far better picture.
Remember that the broader mobile market (handsets excluded) is effectively in deflation. Tariffs aren’t going up (across the board) by the rate of inflation². With the pressures of competition as well as the shift to bundled offers (for voice, data and in the context of post-paid, integrated tariff plans), prices have been going down over time. At best, they’re holding steady.

This summary shows that the post-paid market — measured by revenue — grew by just 1% between 2013 and 2014 and 3% between 2014 and last year. And while post-paid remains less competitive (by definition) than the prepaid market, some trends are very clear over the past 24-36 months. Chiefly, Vodacom has managed to grow post-paid revenue strongly (6%) between April 2014 to March 2015 and April 2015 to March this year. It’s done exceptionally well over time to retain and grow its contract customer base which, by revenue, is now twice as large as its next biggest competitor (MTN). In fact, Vodacom owns 57% of the South African post-paid market by revenue.
MTN has done poorly in recent years, with a nearly R700m decline in its post-paid business between 2013 and 2015. It has been growing this base after some setbacks in 2013/2014, but it’s been forced to hunt for customers at the lower end of this segment. Its average revenue per user trend over the 36-month period illustrates this perfectly, with a drop from nearer the R200 mark in 2013 to the mid-R160 level in 2015.
Cell C’s post-paid base, despite a strong focus on contract buyouts and product innovation, is almost exactly flat across the 36 months (it grew by 2% in 2014 but slipped by 2% in 2015).
Don’t discount the impact of Telkom’s mobile division starting to find its feet. It has managed to double post-paid revenue over the past three years and will easily be half the size of Cell C’s post-paid business in 2016 (about R2bn), given its FreeMe products which have aggressively up-ended the market.
Based on 2015 data, post-paid revenue market shares are: Vodacom 57%; MTN 29%; Cell C 10%; and Telkom Mobile 4%.
We don’t have any data to quantify the impact of mobile virtual network operators (MVNOs) like FNB Connect and Afrihost Mobile. Anecdotally, it seems as if there is a fair amount of switching, particularly at the higher end of the market. But, given the numbers of subscribers involved — less than 500 000 — this isn’t material, yet.

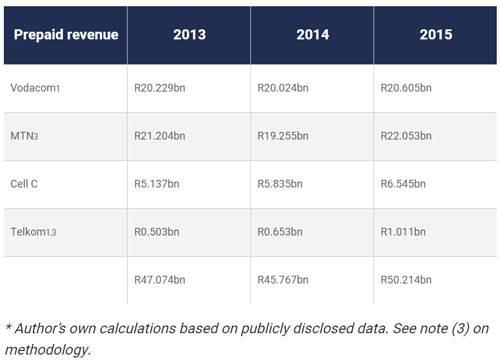
By comparison, the prepaid market is a R50bn one, meaning South Africans spend, on average, R4,2bn on “pay-as-you-go” per month, or about R140m/day. And while there was a 3% decline in total revenue between 2013 and 2014, there was strong growth (10%) between 2014 and 2015.
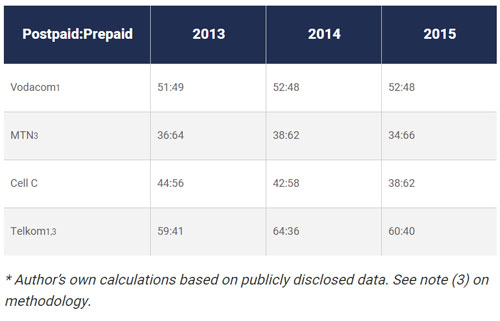
At this point, prepaid is about 56% of the total market, with post-paid at 44%. In other words, for every R100 spent on mobile telephony in South Africa, R56 is on prepaid, while R44 is on contract (subscriptions included, but excluding handsets).
Vodacom’s prepaid business is pretty flat over the 36-month period summarised above with only 2% growth between 2013 (April 2013 to March 2014) and 2015 (April 2015 to March 2016).
MTN’s done well to recover from a horrible year in 2014, with a 15% jump between 2014 and 2015 (after a 9% decline the prior year). Effectively all of Cell C’s revenue growth over this period has been in the prepaid space and it has grown this segment of income by more than 25% (14% and then 12%). Telkom has more than doubled prepaid revenue over the 36 months, but this is off a very low base.
Looking at relative sizes of post-paid and prepaid businesses at each of the operators is interesting, and all four are very different in make-up.

Vodacom’s two segments are roughly evenly split and have remained fairly constant over time. MTN has seen a shift to prepaid becoming effectively two-thirds of its business and Cell C seems to be headed in the same direction. Telkom has the majority of its revenue in post-paid. While it is a (relatively) new entrant, the FreeMe packages should further entrench this split.
Operators (understandably) don’t disclose profits of these various segments. But, post-paid is more profitable than prepaid and — importantly — has far lower churn rates (this shouldn’t be a surprise to anyone). And when you look at earnings and margin data provided by the operators through the lens of this post-paid/prepaid split, you’ll be able to clearly reconcile why Vodacom is managing to grow earnings (and margins), MTN’s are in decline and Telkom’s mobile unit is — at last — profitable (Cell C’s financials are skewed by its mountain of debt).
- Data for MTN and Cell C is for the calendar year, while Vodacom and Telkom figures run from 1 April 2015 to 31 March 2016 (their financial year).
- Sure, operators made upward adjustments to their base contract subscriptions over the past 12 months, but this is one of the very few levers they have. Tariffs are regulated by Icasa and these cannot be changed summarily.
- A note on methodology: Vodacom provides detailed disclosure of post-paid and prepaid revenue (with in- and out-of-bundle splits) and Cell C’s split is available in the Blue Label circular. MTN discloses total service revenue as well as average revenue per user (Arpu) and subscriber numbers per quarter, which means the calculation isn’t too much of a stretch. Telkom provides service revenue and average Arpu (but subscribers as at year-end). This necessitates some adjustment to its split.
- Hilton Tarrant works at immedia. This article was originally published on Moneyweb and is republished here with permission


